Automation Pilot Economics
Commercial exterior-cleaning automation
When is a limited automation pilot economically worth testing for commercial exterior-cleaning work?
Pilot screening only — not a fleet-purchase or vendor recommendation.
Context
Drone- and robotics-enabled cleaning can take some manual work off a crew, but it does not remove the contractor’s costs. Someone still supervises the system, sets it up, handles rework, buys consumables, works around access constraints and pays the vendor. Performance on a real façade is uncertain until it is measured.
The model structures that pilot decision instead of assuming automation is automatically cheaper.
The model
A single representative job, costed two ways:
Pressure / soft washing with ground work, ladders or a lift
Drone- or robotics-enabled cleaning with operators on site
Inputs include cleanable area, manual productivity, loaded labor cost, access-equipment cost, automated cleaning rate, operator count, setup, rework, vendor pricing, eligible volume, availability and the evaluation horizon.
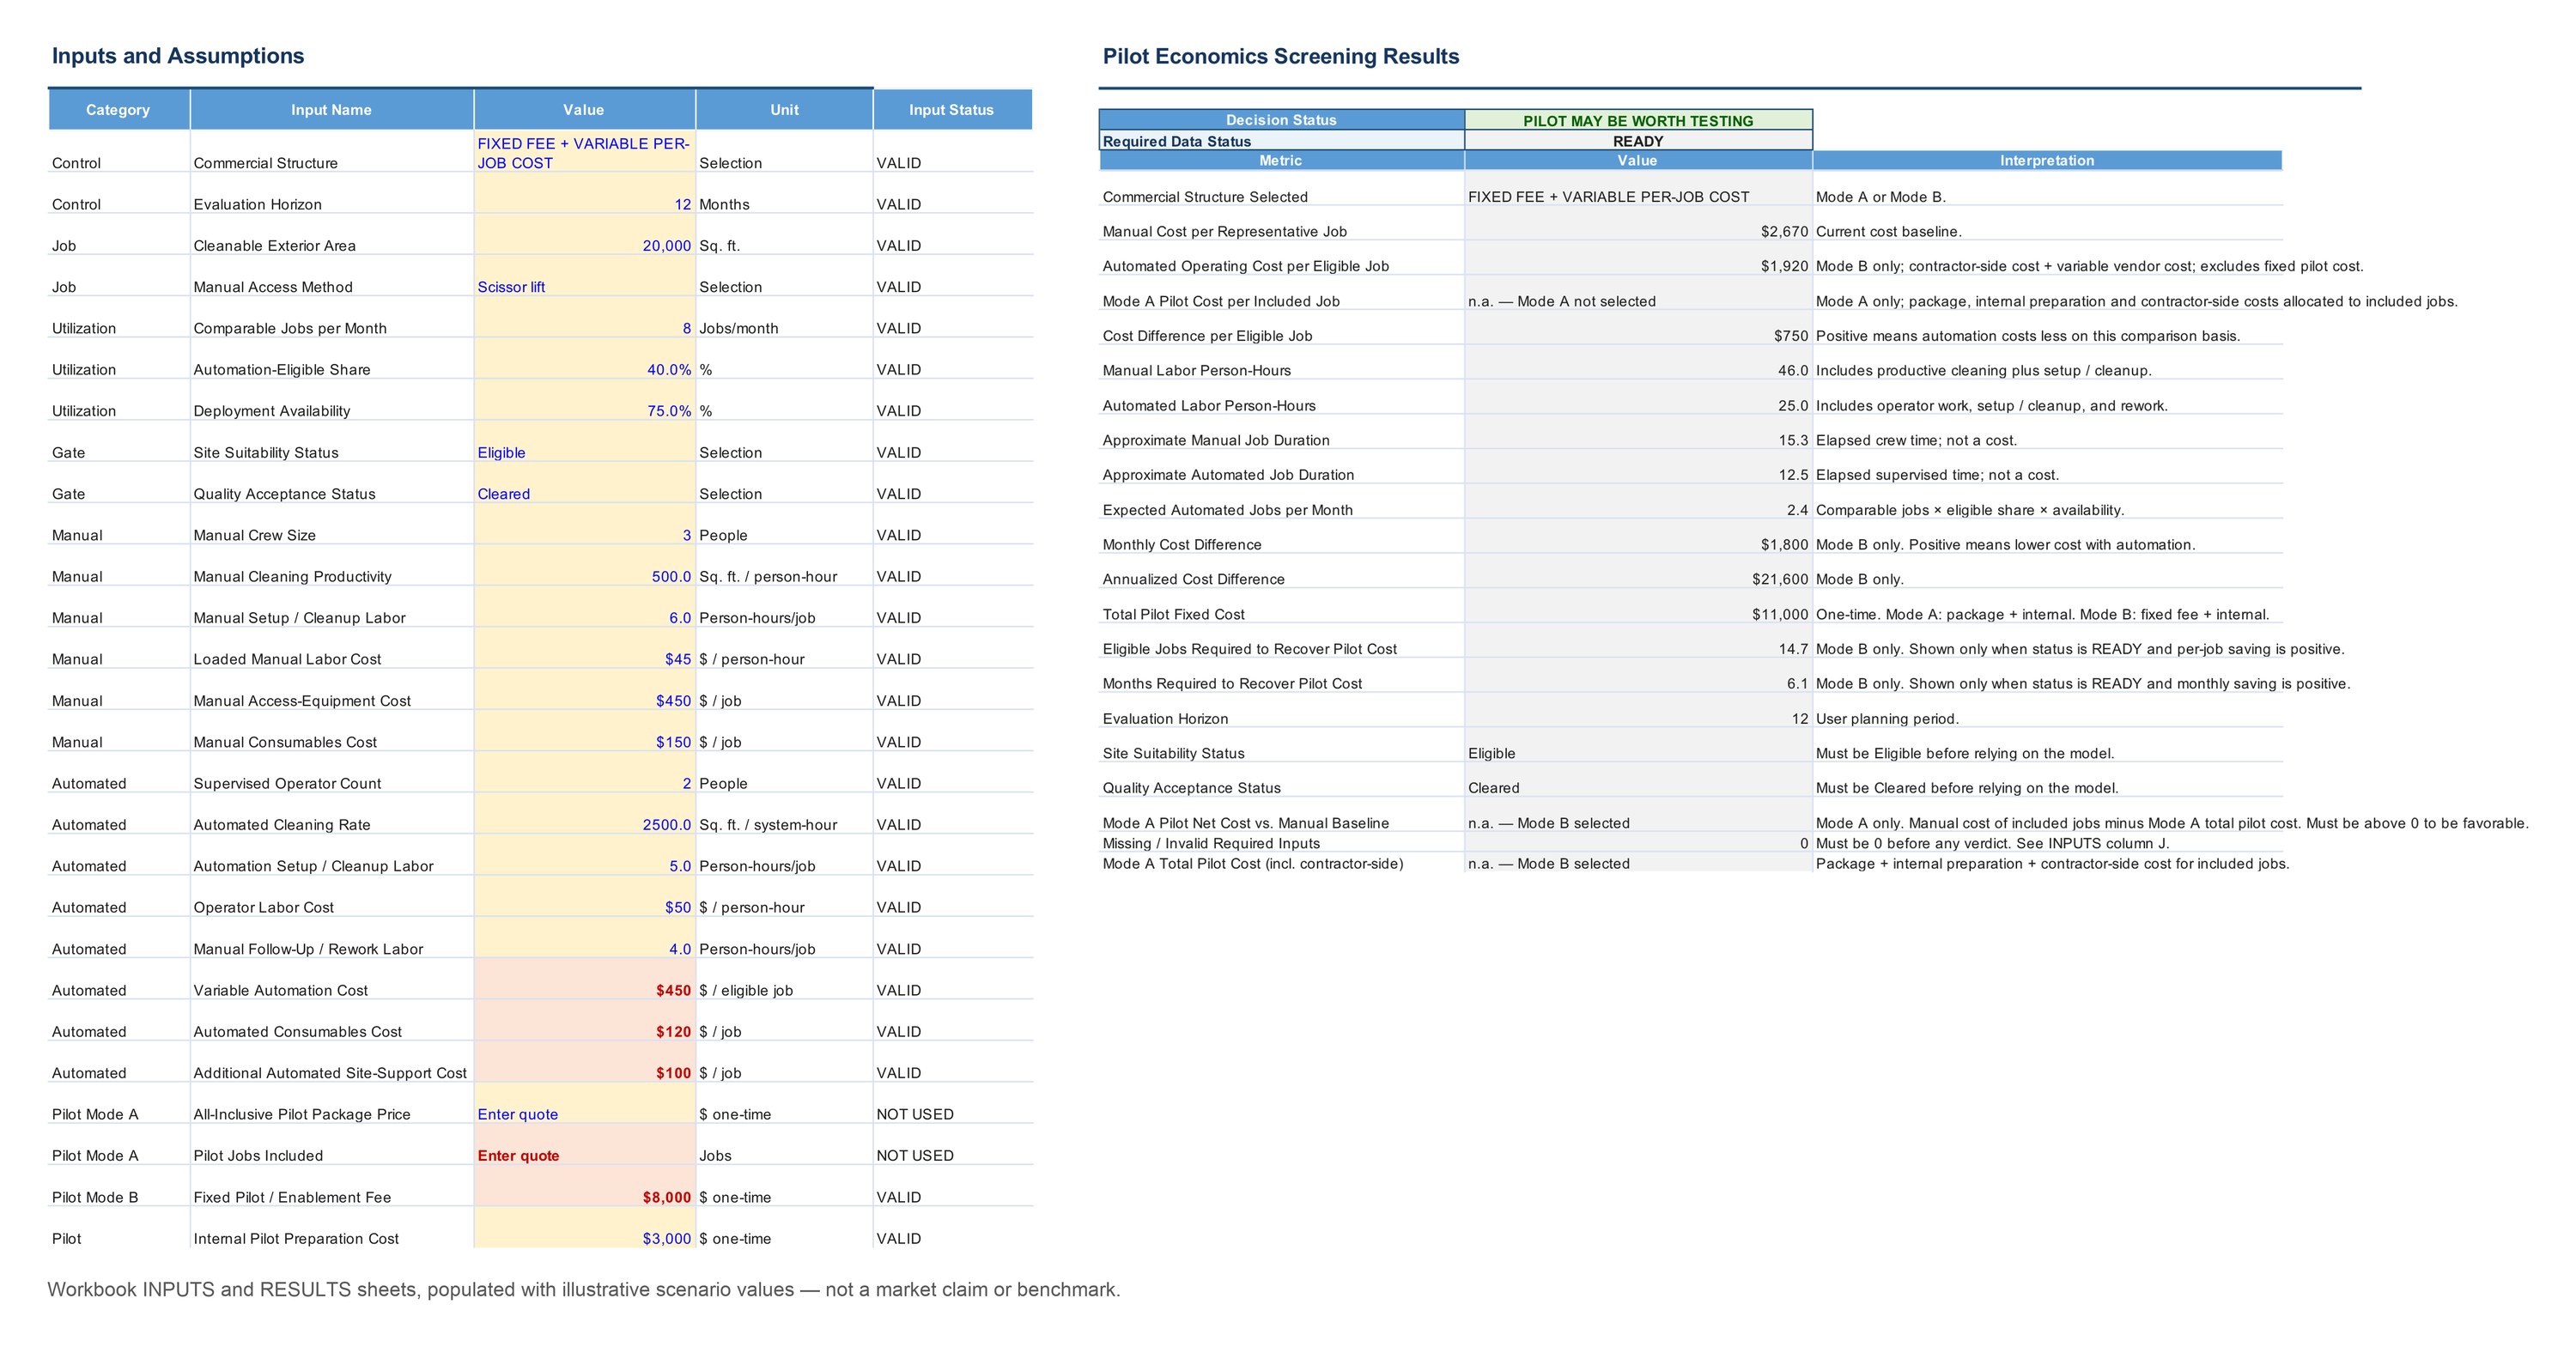
Every required input is validated: a missing value never becomes $0, and site-suitability and quality gates must clear before any verdict appears.
Two commercial structures
All-inclusive pilot package
Does the package recover its cost across its included jobs?
Fixed pilot fee + variable per-job cost
Do per-job savings recover the fixed cost within the evaluation horizon?
In both modes the contractor still carries its own operator labor, rework, consumables and site support.
Key finding
Volume cannot rescue negative per-job economics.
If an automated job costs more than the manual alternative, increasing volume only scales the loss.
What drives the decision
- Manual labor cost per sq ftloaded labor rate ÷ manual productivity
- Automation labor cost per sq ftoperators × operator rate ÷ automated cleaning rate
- Cleanable job areaspreads fixed per-job overheads
- Usable job volumejobs/month × eligible share × availability
- Vendor pricingfixed fee, variable cost, package price, jobs included
These are decision drivers, not universal benchmark values.
Illustrative scenario
Illustrative model scenario — not a market claim
These inputs were constructed to show how the model behaves. They do not represent an actual contractor or vendor.
Worked example: One representative 20,000 sq ft job, costed two ways. The model’s input checks are treated as met.
-
Manual cost per job $2,670. Automated cost per job $1,920: the contractor’s own operators, setup, rework, consumables and site support, plus the vendor’s per-job cost.
$2,670 − $1,920 = +$750 per job
-
8 comparable jobs per month × 40% automation-eligible × 75% deployment availability.
= 2.4 automated jobs per month
-
Each automated job carries the $750 saving. Volume multiplies the per-job difference; it cannot change its sign.
2.4 × $750 = $1,800 per month
-
Paid once, at the start of the pilot.
$8,000 fee + $3,000 internal preparation = $11,000
-
$1,800 accumulates each month against the fixed cost.
$11,000 ÷ $1,800 ≈ 6.1 months
-
PILOT MAY BE WORTH TESTING
+$750 per job > $0 · 6.1 ≤ 12-month horizon
If any input check fails, the model returns DO NOT RELY ON RESULT. A screening result — not a purchase or vendor recommendation.
Decision boundaries
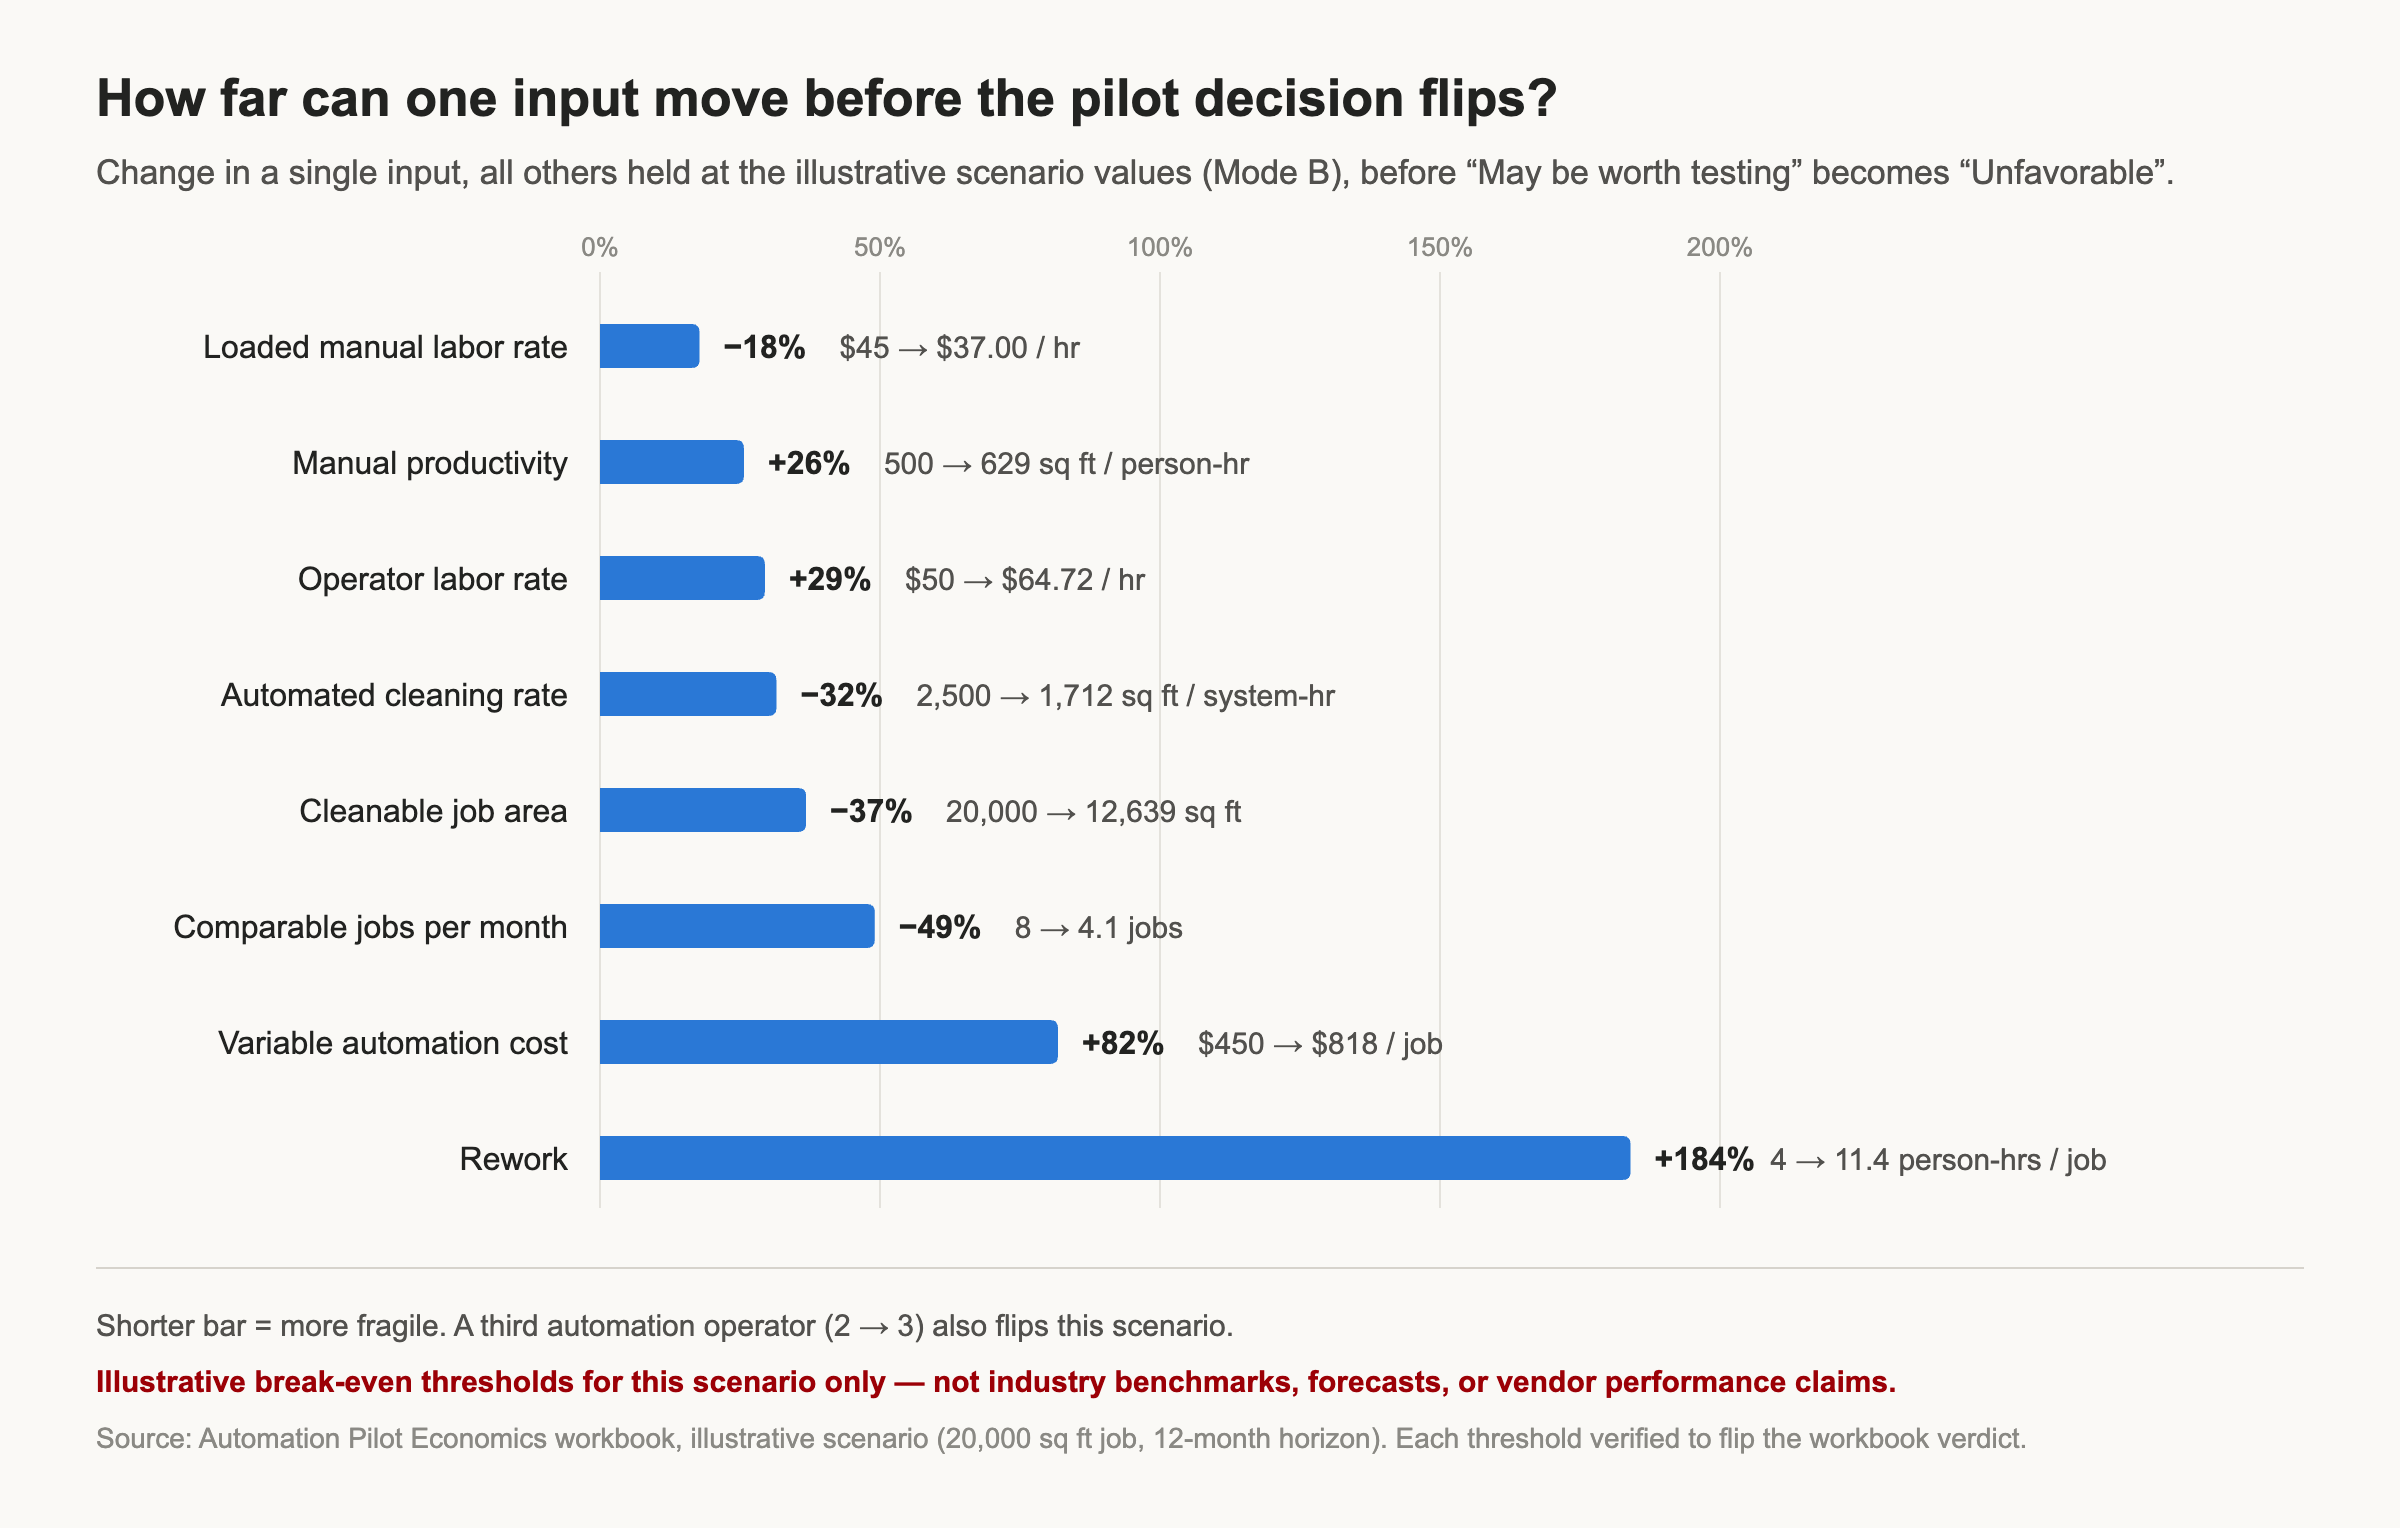
Illustrative break-even thresholds for this scenario only
| Input | Decision flips at |
|---|---|
| Automated cleaning rate | below ≈1,712 sq ft / system-hour |
| Variable automation cost | above ≈$818 / job |
| Rework | above ≈11.4 person-hours / job |
| Cleanable job area | below ≈12,639 sq ft |
| Comparable job volume | below ≈4.1 jobs / month |
What must be measured
Contractor records
- Cleanable area
- Actual person-hours per job
- Loaded labor
- Access-equipment cost
- Comparable monthly volume
Pilot measurements
- Achieved cleaning rate
- Setup time
- Rework
- Site eligibility
- Availability
Vendor quote
- Pilot / package fee
- Variable cost
- Jobs included
- Operator requirements
- Exclusions
Model limitations
- One representative job, not a mixed portfolio of job sizes
- No fleet purchase economics
- No financing or depreciation
- No learning curve
- No weather cancellations
- No damage or liability modeling
- No guaranteed vendor performance
- Cleaning rate and rework must ultimately be measured in a pilot
The model supports a pilot-screening decision, not a fleet-purchase recommendation.
Process
- Scope
- Inputs
- Source assumptions
- Model
- Audit
- Repair
- Threshold analysis
- Operator summary
The first version calculated correctly but was not decision-safe. An audit with explicit test cases found blank inputs could become $0 and still produce a verdict, and the package mode omitted the contractor’s own costs. The repair validated every input and restored those costs; the repaired model passes a 43-case regression suite.
Final artifact
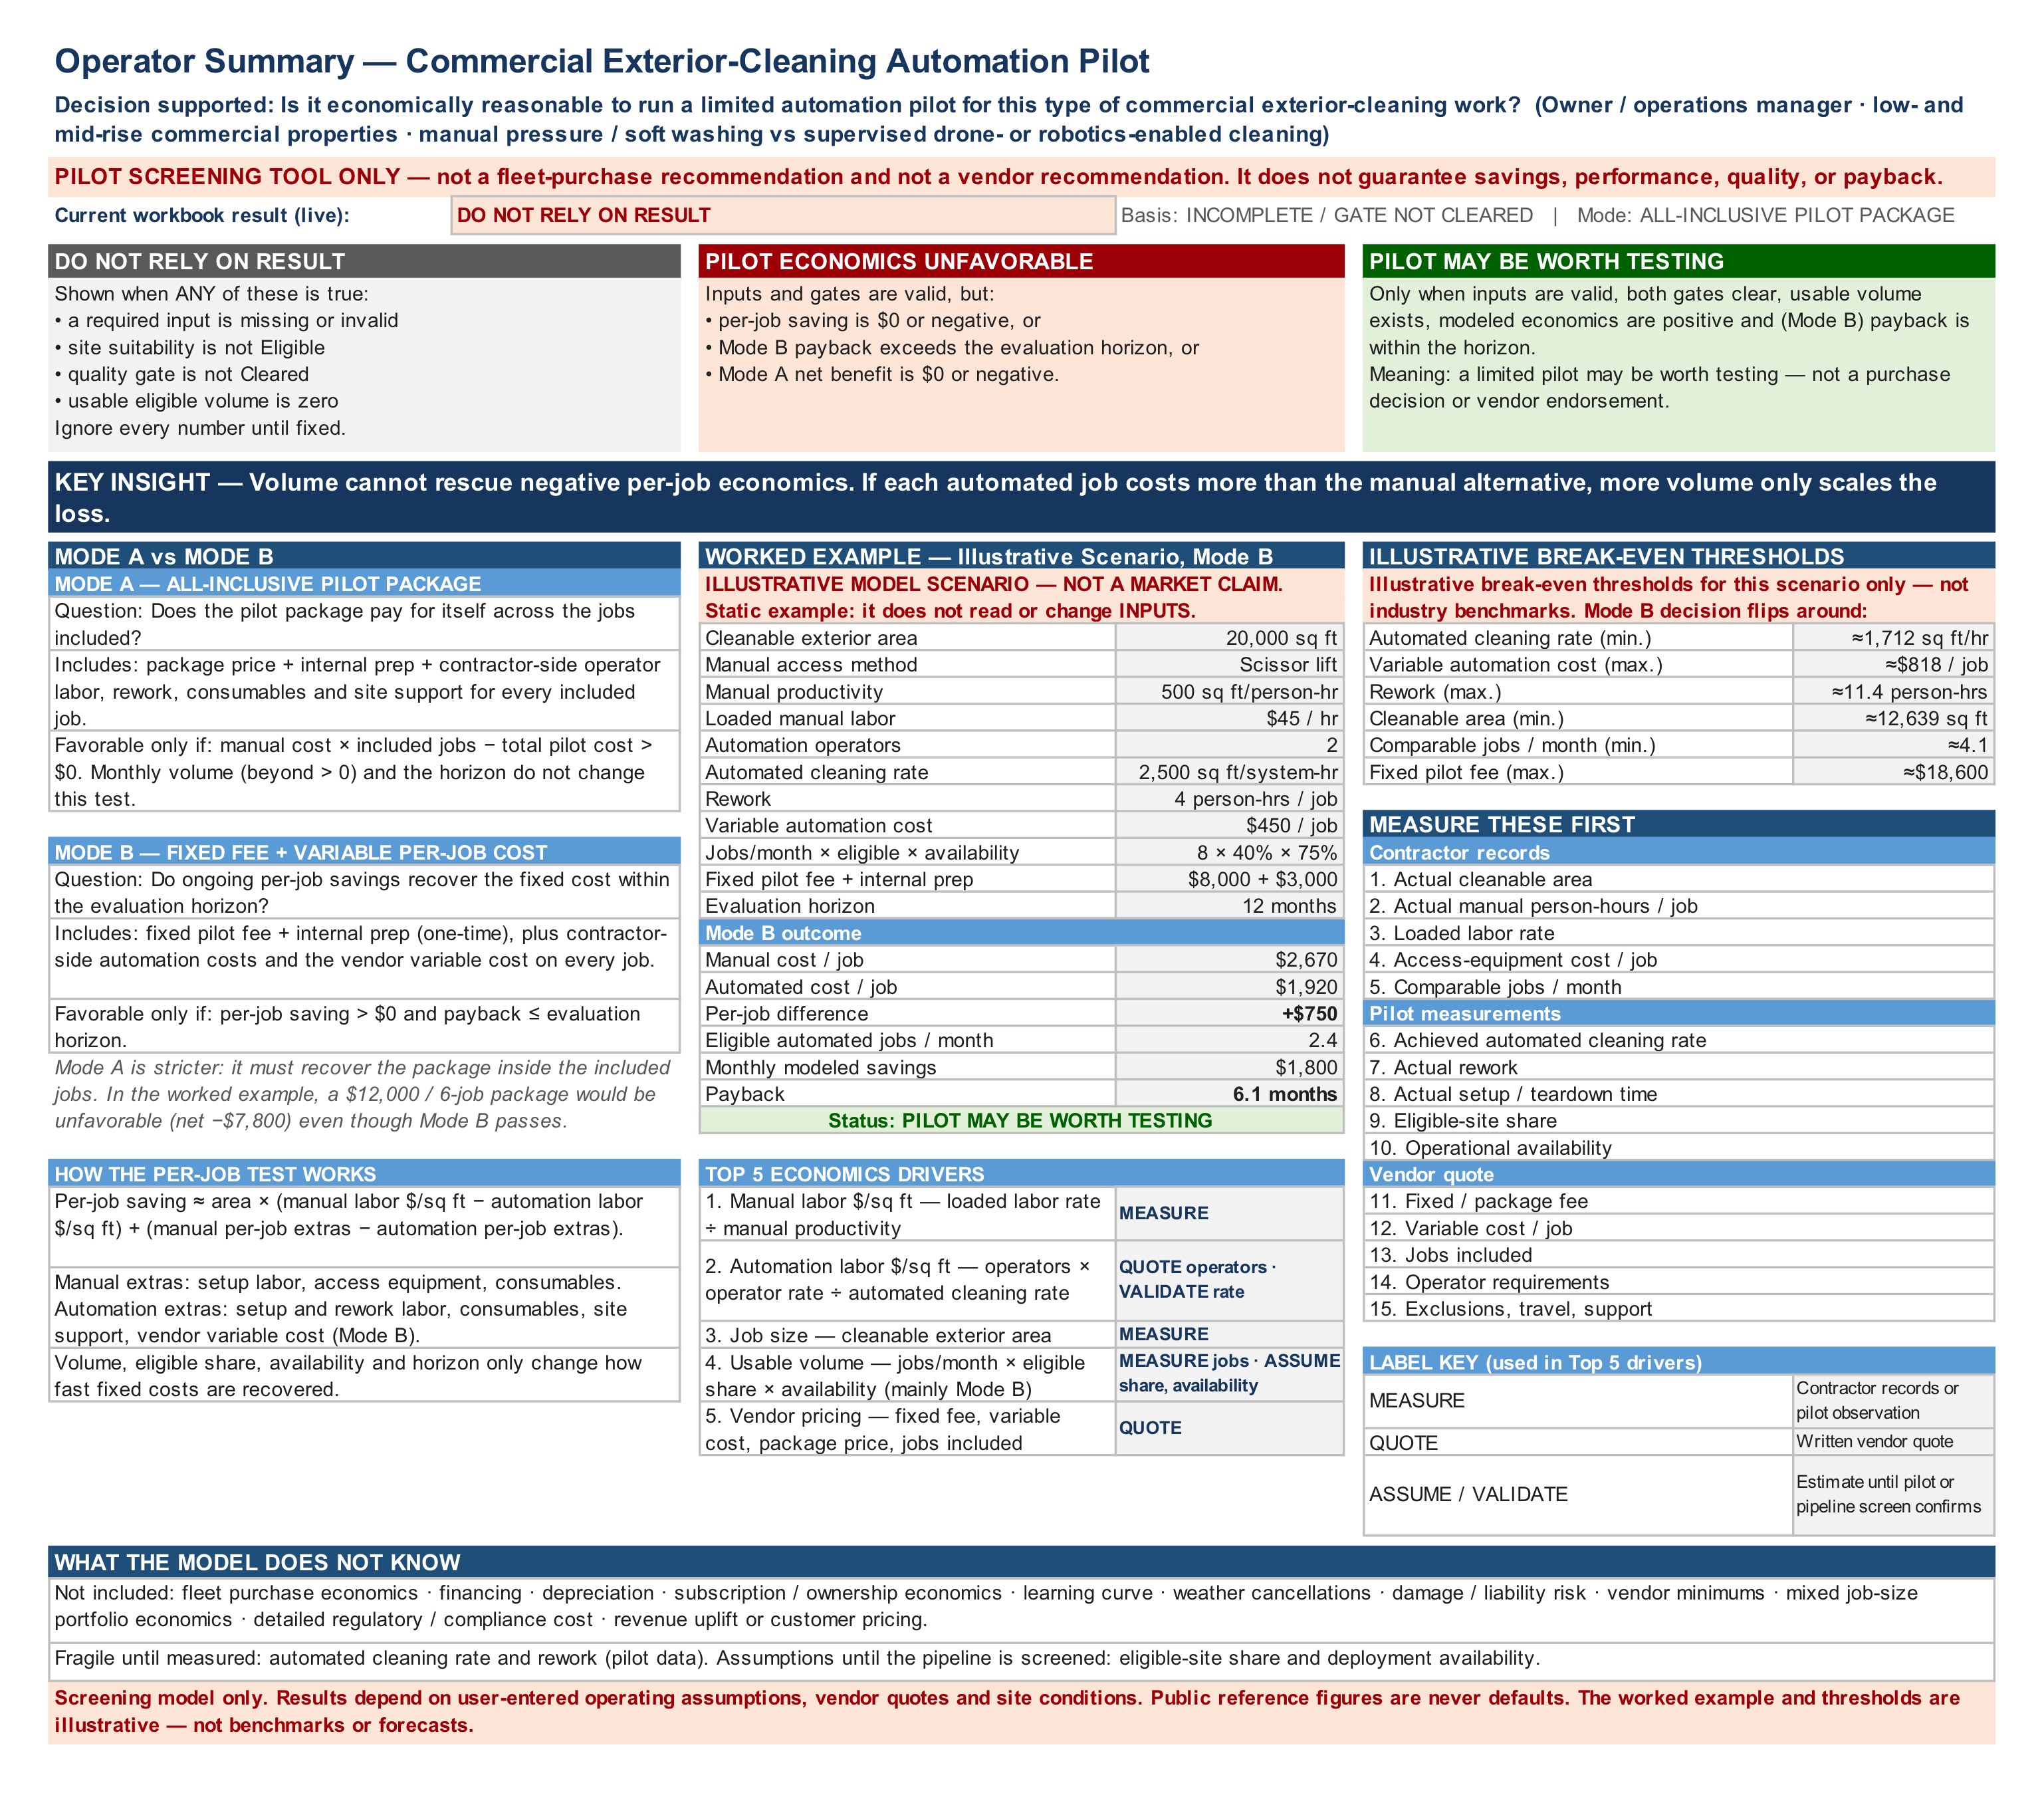
A one-page summary for an owner or operations manager: when to ignore the result, what drives it, and what to measure first.
Downloads
- Download Operator Summary
- Download Calculator Workbook
Pilot-screening model. Illustrative inputs are not industry benchmarks.
Independent model built for illustration. Not affiliated with, or endorsed by, any automation vendor. Public reference figures are used for context only, never as defaults.